If you are planning to buy or have already bought a stock for a trade - and in the process of deciding whether to keep that trade or sell it - following is the logic I apply. Thought to share the logic for one of the beaten down stock (Paypal).
This is the Paypal Weekly Chart:

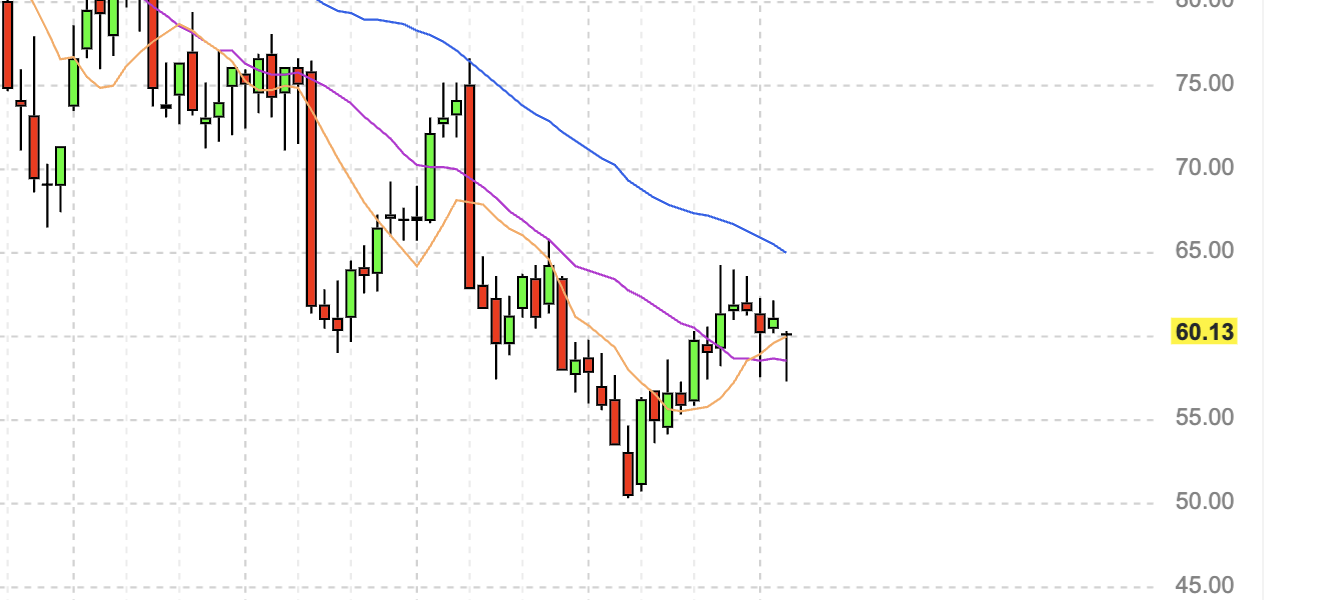
As you can see in the chart - you will be able to identify recent low and recent high price. Recent low was in the month of October for the price of 50.25. When stock goes above 20% from the recent low price - it is considered to be in it's bull market. It takes lot of buying of a stock to fetch it above 20% and that means, buyers are considering that as a good long term trade/investment. 20% above 50.25 would be around 60.30. Recent high in December for Paypal was 64.13$ (which means it went above 60.30 price target) and is in the bull market of its own. So, you buy the dip in the bull market - whenever presented.
However, reverse theory is also applicable, which is when stock is below 20% from its recent high - it is in the bear market. So 64.13's 20% would be somewhere 51.30$. So if Paypal closes below 51.30, you get out of that stock as it is in its bear market. Until then, Buy the Dip.
No comments:
Post a Comment